Your business
Are orders still coming in?
The outcome you actually care about. It stops for dozens of unrelated reasons, which is exactly why it is worth watching on its own.
Order flow stopped
Watched by luroConnect

A server monitor answers one question: is the machine responding? It cannot tell you that checkout has been failing for twenty minutes, that your crons died over the weekend, or that a queue stopped draining on Tuesday. luroConnect watches those too — and the alert comes to us, before it has to come to you.
The gap
Every layer below can fail on its own while the layers beneath it stay perfectly healthy. That is why “all systems operational” and “the store is working” are different statements — and why a host that only watches the bottom row can tell you the truth and still be no help at all.
Are orders still coming in?
The outcome you actually care about. It stops for dozens of unrelated reasons, which is exactly why it is worth watching on its own.
Order flow stopped
Watched by luroConnect
Is the store doing its work?
The scheduled jobs and background queues a store runs on. When they stop, pages keep serving perfectly while the work behind them quietly stops.
Crons in trouble · queue not draining
Watched by luroConnect
Is the machine responding?
Necessary, and not close to sufficient. This is where most hosting monitoring begins and ends.
CPU · memory · disk · ping
Watched by most hosts
Alert · Your business
On a store that takes orders continuously, a gap is information. This alert watches the one number no server graph contains, and it does not care why orders stopped — which is precisely its value. Every cause below produces the same alert, and none of them move CPU, memory or disk.
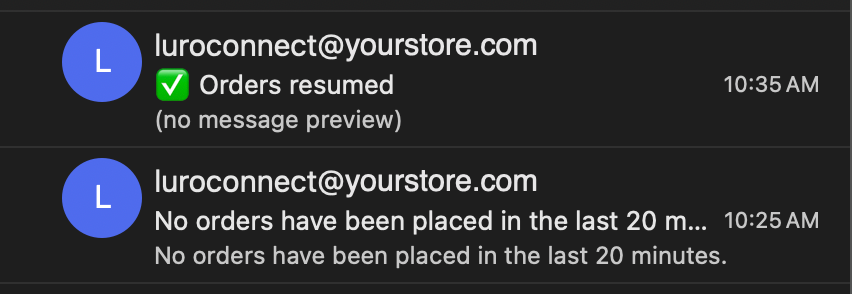
How many orders, in how long, is a setting — and the right setting is a fact about your store, not a vendor default. The check also runs differently through the day: a tight window checked every few minutes while you are trading, a wider one checked less often overnight, when a quiet stretch means nothing.
A store taking hundreds of orders a day can be baselined tightly, and twenty minutes of silence is a genuine signal. A store taking thirty a day cannot — a quiet two hours is just a Tuesday, and an alert that cries wolf is worse than no alert. If your volume will not baseline, we will tell you, and lean on the application-level checks instead.
Alert · Your application
A store's scheduled jobs are where most of its real work happens — emails, indexing, stock and price updates, scheduled promotions, integrations with everything else the business runs on. When they stop, the storefront carries on serving pages beautifully. Nothing errors. Nothing goes red. The work simply stops happening, and you find out days later from a customer asking where their confirmation email is.
There is no threshold to set here. Asking “is cron running?” is the question that misses the failure — a cron process can be alive and achieving nothing. So the checker reads several things at once and works out for itself when the picture is wrong.
Cron work has its own machine, and its own normal. A server pinned flat, or suddenly idle when it should be busy, is the shape of jobs failing.
The most common way a long-running job dies is that the kernel kills it. That leaves a line in the system log and no error anywhere a merchant would look.
We read the mail log. A store can believe it sent every order confirmation while nothing has left the building since Friday.
Alert · Your application
Modern stores push work onto queues so the shopper never waits for it: order exports, bulk catalog updates, stock synchronisation, asynchronous indexing. A queue is healthy when it drains as fast as it fills — and a deep queue during a bulk import is completely normal. Size, on its own, tells you almost nothing.
So we do not alert on size. We alert when the number stops going down. A queue that is not draining means the consumer behind it has died or fallen behind, and that is true whether there are two hundred messages in it or two million. Nothing to configure, and no false alarm every time you run a catalog update.
Also watched
Not everything needs to be clever. Two checks are straightforward thresholds — but thresholds set against how your store actually behaves, rather than a number that came with the monitoring tool.
Response time measured against what is normal for your store, so a gradual slide gets caught while it is still gradual — not on the day it becomes an outage.
A rising rate of 5xx responses, which is how a broken deploy, an exhausted connection pool or a failing dependency usually announces itself first.
What happens when one fires
Plenty of hosts will happily send you an alert and consider the job done. That is a dashboard, not support — it moves the work to you. These checks were built for our own on-call team to act on, which is the only arrangement where an alert at 2am is worth anything.
1 · Detection
Most of these need no configuration at all. The cron and queue checks work out what wrong looks like on their own; only the orders check is set up per store.
2 · Escalation
These alerts exist for our on-call team — that is who they were built for. You or your agency can be added to any of them, and some merchants want everything while others want only the orders alert. Both are normal.
3 · Investigation
This is the part a server-level host cannot do. We look at logs, queues, indexers and integrations, rather than confirming the machine is up and closing the ticket.
A store's product pages slowed to a crawl overnight. Server metrics were normal — CPU fine, memory fine, disk fine. Our team traced it to a cache rebuild storm triggered by a replica disconnection deep inside the application stack. Root cause identified and fixed the same day. A server-level host would have closed that ticket with “all systems operational”.
The rest of the platform
These checks are not a bolt-on monitoring product. They come out of the request and application data luroConnect already parses for every store it hosts — the same data behind cache reporting, traffic classification and bot controls, where a crawler flood can be blocked, challenged or allowed by user agent rather than by chasing IP ranges.
Log Export
Every AI crawler and assistant fetcher named individually, from the same request logs these checks are built on.
Read more →Transparent image optimization
AVIF and WebP at the hosting layer, off the PHP path, with the original served if anything goes wrong.
Read more →Honest pricing
A fixed monthly retainer by band, with your cloud bill paid at cost directly to AWS or GCP.
Read more →No. Uptime monitoring answers one question: did the server respond? Most of the alerts on this page assume the server is responding perfectly — that is the situation they exist for. A store can return 200 on every page while orders, crons and queues have all stopped.
Our on-call team. They were built for us, not as a dashboard to hand you, and that is the point — you should not have to be the monitoring system for your own store. You or your development agency can be added to any of them if you want to see what we see.
Almost none of it. The cron and queue checks detect trouble on their own, with no thresholds to pick and nothing to tune. The orders check is the exception: it has to be baselined against how your store actually trades. Slow-page and error-rate alerting use thresholds set for your store.
Probably not, and we will say so. The alert works by knowing what normal looks like, and normal has to be stable enough to baseline. A store taking hundreds of orders a day can be baselined tightly. A store taking thirty cannot — a quiet two hours is just Tuesday. The application-level checks work regardless of your order volume.
The alerts go to us first, so the default answer is that you are not woken at all. Beyond that: the orders check is scheduled differently through the day, with a wider window overnight when a gap is expected, and it sends its own all-clear when order flow resumes rather than leaving a resolved problem sitting in an inbox.
We tell you what we found and work with your development agency to get it fixed. We are a hosting and operations partner, not a development agency — we do not compete for that work, and we do not hand the ticket back with “no issue found on our side”.
The checks are configured per store rather than shipped as a fixed list. Scheduled jobs and queues exist in every commerce stack we host; what changes is which ones matter and what a healthy one looks like.
If the honest answer is “a customer would tell us”, that is worth half an hour. Your store runs in your own AWS or GCP account, and these checks are set up for the way your store actually trades.